Chart of the Day

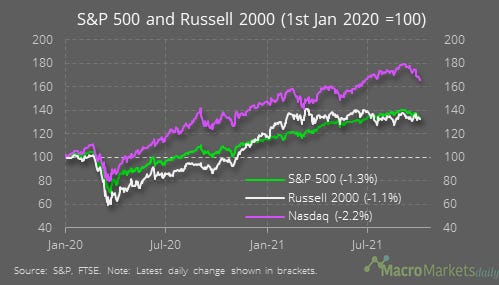
Tech stocks led the way amid the broad market sell-off yesterday, with the Nasdaq falling by 2.2% while the tech sector of the S&P 500 fell by 2.4%. Technicians are worried by the observation that the Nasdaq has now broken past its previous support levels, which could mean there is further weakness ahead. Aside from the outage issues affecting Facebook yesterday, much of the narrative around this sell-off has been about the withdrawal of monetary policy support. But as this chart shows, real yields (inverse on this chart) were unchanged yesterday and have fallen a touch in the past week. Naturally, narratives matter in markets, but unless yields start rising again this correction may not be as bad or last as long as many suggest.
Macro
Australian exports rose sharply to a new record in August.

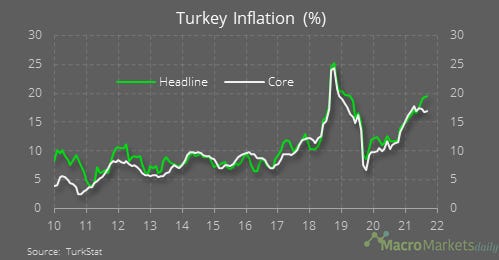
Turkey’s facing inflation of 20% – that didn’t stop the central bank cutting rates last week though.
Markets
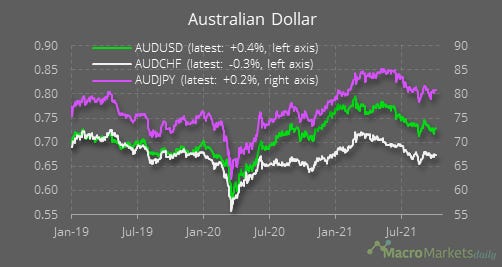
Australia’s exports will come back down soon after the sharp fall in iron prices in recent months.

That explains why the strong trade surplus has done little for the AUD, which has depreciated since the summer.
The other major markets have done better than the Nasdaq recently, due to the lower weight of tech stocks in those indices.
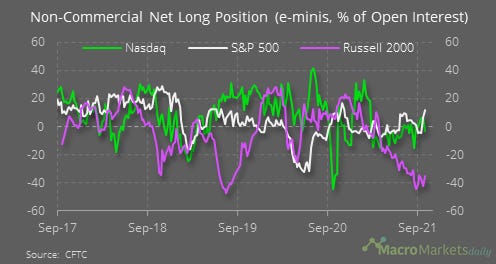
One worry is that investor positioning on the Nasdaq still looks neutral, so an increase in shorts could still propel the market lower. Conversely, short positioning on the Russell already looks stretched.
Traders have sharply reduced their net position across key commodities in the past months.
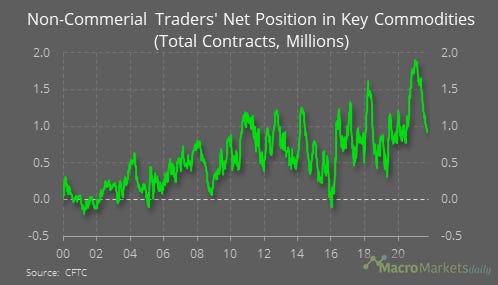
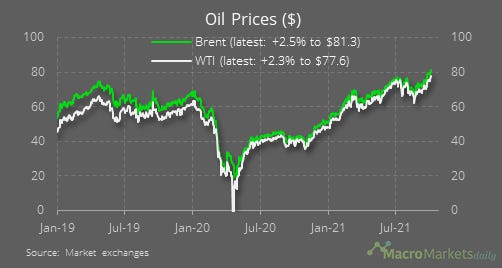
That’s been a bad call for oil. OPEC opted not to increase output by any more than already planned, which sent the price to a new multi-year high.
Like what you see? Please forward this email to your friends and colleagues, or use the button below to share it on social media. They can also follow us https://twitter.com/macro_daily