Chart of the Day
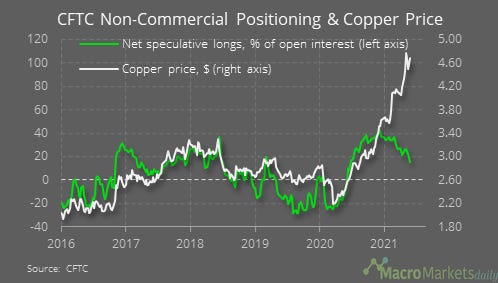
Non-commercial traders cut their net position in copper again last week, to +15% of open interest (i.e. outstanding longs + shorts), from over 40% at the start of the year. That could be a sign that speculative traders have little faith copper will rise much further, which could be a worrying sign for the global economic outlook given copper’s reputation as a forward-looking indicator for the health of the economy – i.e. Dr Copper. It would be a stretch to say this is a sign of impending doom, though. Traders might expect a period of price weakness, but that doesn’t mean they expect copper prices to collapse. Most analysts expect copper to be in very high demand in the coming years as electric vehicles grow in popularity.
Macro
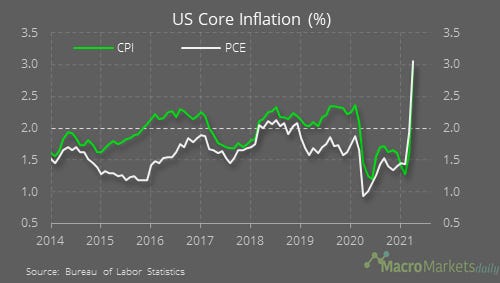
An important one to watch – the Fed targets PCE inflation, which is often lower than CPI inflation, especially on a core basis. But that has now switched, with core PCE above core CPI for three months, and now above 3% as well
The personal income and spending data for April showed the household saving rate fell. It is still high at 15% though.

The eurozone ESI rose in May and looks consistent with GDP growth of 4% YoY.

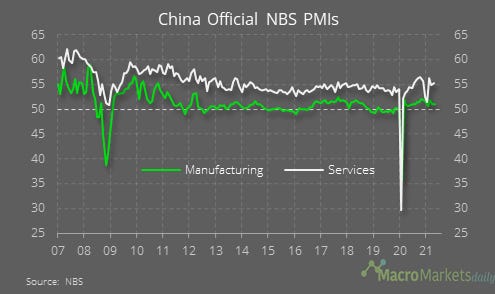
In China, the manufacturing sector is losing steam – the official manufacturing PMI fell to 51.0 in May, while the services PMI increased to 55.2.
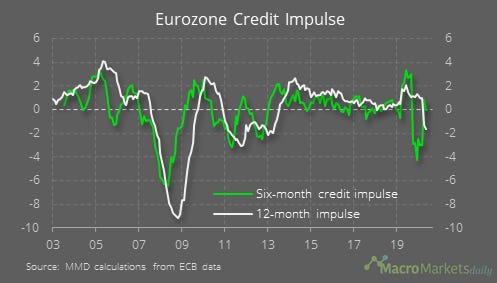
In the eurozone, the flow of credit to the private sector was negative in April, which pulled the six-month credit impulse to 0 and kept the 12-month impulse negative.
Markets
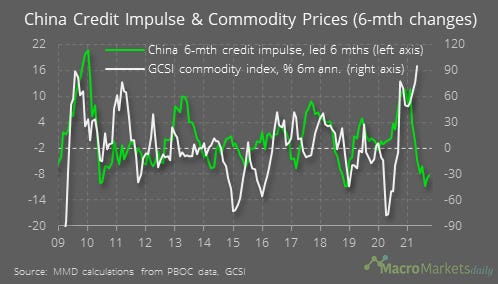
China’s 6-month credit impulse might be pointing to weaker commodity price growth, which could explain why traders are trimming their price expectations in copper.
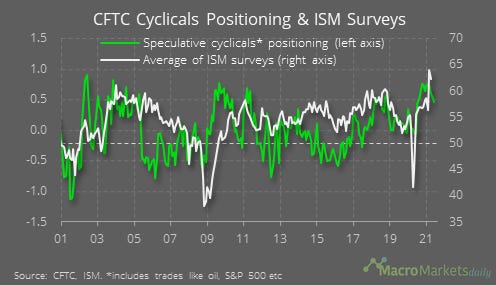
Speculative positioning in cyclical trades continues to decline, which suggests the business surveys will follow suit.
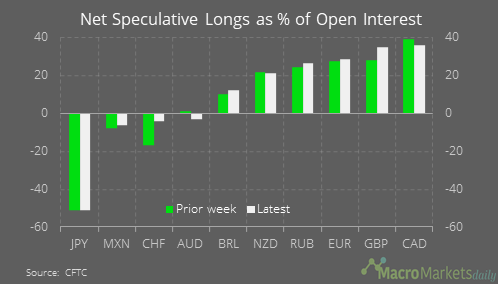
Traders are currently most long the CAD relative to open interest, and built their net long in GBP last week.
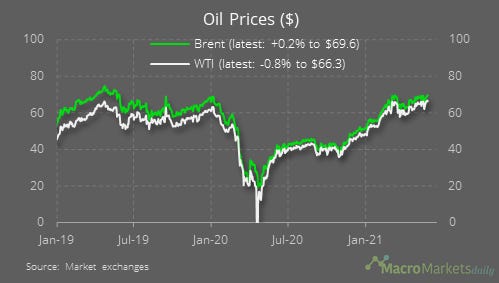
Oil is one to watch this week – it could break out of the trading range it has been in so far this year, though many analysts are concerned that there is still a lot of supply to come back to the market (daily moves here refer to Friday).
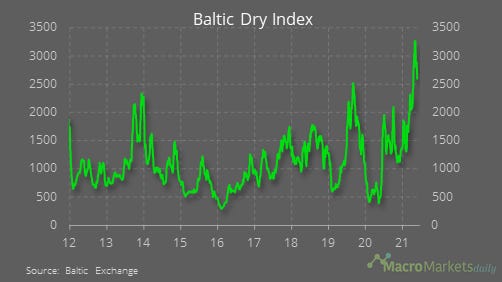
The Baltic Dry Index has fallen by 9.5% in the past week and is now down by 12.2% in the past month – a sign that supply constraints are easing?
Like what you see? Please forward this email to your friends and colleagues, or use the button below to share it on social media. They can also follow us https://twitter.com/macro_daily